 How to resolve AdBlock issue?
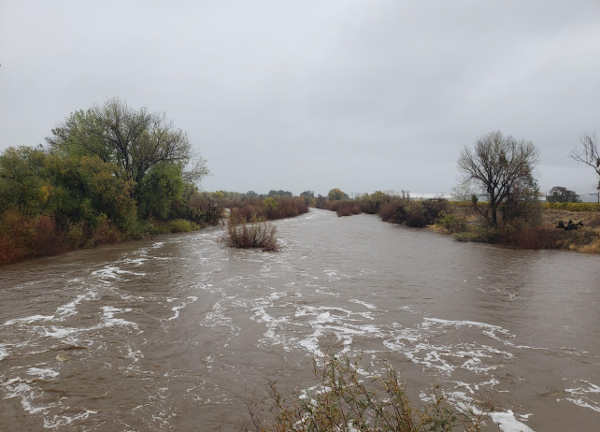
Dear Lady of the Lake,
The storm season is upon us and I am very glad we are seeing some rain. However, I am concerned about flooding. Where do I find out about local stream and river information? Is there a stream gage in my area and where do I find that data?
“Streaming Stream data” Steve
Hello Steve,
Great questions! Yes, this is the time of year that learning how to get real-time stream and river data is very important. There are many reasons that one would want to get that information, and you touched on the most important one: to best plan for and predict a potential flooding event.
Real-time stream data basically means that a gage in the river is transmitting data as it’s being collected in real-time and that data is then available at an accessible location, usually online. The technology that makes this possible is remarkable and I am grateful every day that the access to this type of information, literally, at our fingertips.
Before we get too deep into the available stream data resources, let’s review some terminology that will be helpful.
Stream stage = height of the water from the bottom of the stream. During the last major storm event, Sunday, October 24th during the atmospheric river storm event, the stage of Middle Creek got to 11.0 feet. Unlike Clear Lake, stream stage is measured in just plain metrical feet. For more information on the Lake Level measurement and gage information, revisit my previous column about lake levels (October 17, 2021).
Stream flow or discharge = this is velocity or speed of the water and the amount of water flowing past the point where the measurement is being collected, generally at the gage station. For example, the discharge of Middle Creek during the last storm was 1,400 cubic feet per second, or CFS. So in one second, about 1,400 cubic feet of water passed the gage on Middle Creek. That is quite a bit of water for our regional creeks, but to put it in perspective, The Mississippi River has an average discharge of 593,000 ft³/s!!
Prior to the most recent heavy storm event, our local Middle Creek had a CFS of 2 before the storm event. That is very little flow, however most of the other creeks in our area were completely dry, so again, we demonstrate how useful stream gage information can be for both tracking wet and dry conditions.
Forecast = a statement of prediction. For the stream gage, the river forecast visually shows predicted conditions of stream stage, flow, discharge, and sometimes even precipitation based on climate data and expectations for upcoming weather.
Guidance = is the modeled predicted conditions of stream stage and flow. Usually this is based on years of previous data and models, in conjunction with forecast information. Guidance is more of a “sure thing” than forecasted data, but they are both expectations of future conditions and are subject to change.
Types of data and information
Most of the real-time stream gages also collect precipitation measurements (i.e. rain gages), so when the data is uploaded/downloaded by an agency, the rainfall / snow amount can easily be correlated with stream condition, and in some cases help to inform river stage and flow guidance.
Usually stream gages are equipped to transmit their measurement data to a central data center location (through telemetry or satellite). The data is verified and reviewed and then posted online. Some of the gage data is reported in hourly or daily increments. Sometimes there are gages that collect measurements every 10-15 minutes and the data is posted a day or two later. Some gages relay information during critical events - like during an atmospheric river surge!
While some gages only measure and relay the current conditions, there are some organizations that provide more information than just current stream data, like predictive precipitation, future stream stage and predictive stream flow. Prediction data is nice because it allows the user to plan for effectively. This is especially important during flood season.
Water Resource managers use stream stage data regularly. Safe operation of diversion structures, weirs, or dams are dependent on the opening or closing of structures and gates at certain thresholds of stream stage or flow. Predictive gage information is valuable because it allows managers to monitor multiple stream gage sites at once without having to sit on site in potentially hazardous conditions for hours waiting for the threshold to hit.
Prediction data is also wonderful in that it allows the public to use the same tools that are available to researchers and agencies - making it easy for everyone to be best prepared when conditions change are of a concerning nature.
If you live adjacent to a stream or river and are concerned about flooding, I would look into exploring if a stream gage is located somewhere on that stream system. You don’t need to be near a stream gage for the data to provide value, as long as one is located somewhere along the stream.
Some gage stations even have automatic alerts you can set up on your smartphone that will automatically send a text message should a specific river or stream reach a certain stage or flow. A good place to learn about such a tool is USGS WaterAlert.

It’s flood season
It’s worth mentioning that last week (Oct 23 to 30) was California’s Flood Preparedness Week as proclaimed by the California Department of Water Resources (CDWR). The CDWR periodically comes to Lake County and trains the County and City staff how to prepare, respond, and mitigate flood emergency events should they occur. It’s a great service provided by the CDWR to our local agencies.
You can learn more about California’s Flood Preparedness Week here and you can learn more about FEMA’s National Flood Insurance Program here.
Just like fires, floods can cause localized and regional disasters, and it’s best to prepare for a flood event in a similar way you prepare for a potential wildfire; know the evacuation routes, pack a go-bag, and most importantly, know how to monitor local conditions during flood season.
Monitoring local streams and rivers
There are lots of resources available online for anyone to access real-time stream and river data. I will share two of my favorites with you. Warning: I am a data nerd and a data snob. I like my data clean and organized and I think everyone should have those same standards when it comes to environmental and public safety data.
You can be a data nerd too if you take the time to explore and learn about these websites and the information they contain, that is the way to get the maximum benefit from them. I recommend finding your nearest stream gage and being familiar with how to understand the data output before you absolutely need it, like during an emergency flood situation.
My personal favorite site is the California Nevada River Forecast Center. I can not emphasize enough how much I love this website; I have all the Lake county gage pages from this website bookmarked on my phone browser and my work and home computers. If this were a movie review, I would give this website five stars, the biggest popcorn, the reddest tomato or whatever the highest rank would be. I think this website is one of the best for monitoring past and current rain and stream conditions and is one of the easiest platforms to understand stage and flow predictions.
The California Nevada River Forecast Center, or CNRFC, is a field office of the National Weather Service located in Sacramento, California. The CNRFC is co-located with the Sacramento NWS Forecast Office, CDWR, and United States Bureau of Reclamation. The NWS is an agency of the National Oceanic Atmospheric and Administration, or NOAA, under the United States Department of Commerce.
This site is great for monitoring flash flooding, river forecasting, managing water resources, or learning about hydrometeorology. Also the maps and graphs are very easy to use and interpret. This site can also provide temperature conditions and predictions which can be used for frost protection planning, for example. Additionally, this site has incorporated some post-fire debris flow warning layers. So if you live in an area that has a burn scar nearby, this website can help you to visualize those areas most at risk to post-fire flooding and debris flows.
This website has a lot to offer, that is best explained visually, so I made a video tutorial that can help you explore some of the key features of the site and how to find regional stream stage and flow data from neighborhood gages here in Lake County.
In this video tutorial, Lady of the Lake demonstrates how to access local stream gage information on both the California Nevada River Forecast Network and California Data Exchange Center Websites.
The next resource is California Data Exchange Center, or CDEC. This website is managed by the California Department of Water Resources and while it does have some prediction power, the majority of gage information here is real-time and archival. However, it’s pretty easy to use and has a large network of gages and data that expands across all of California.
According to the website, “The primary function of the California Data Exchange Center, or CDEC, is to facilitate the collection, storage, and exchange of hydrologic and climate information to support real-time flood management and water supply needs in California.” This is a great tool that does provide the necessary river and flood information for an agency or a member of the public.
One thing about the CDEC is the data is focused on river information. The tabs at the top of the home page provide a lot of the type of data and tools available, and makes it easy to search for what you might need. Historic water data is also easily available on CDEC, making it easy to conduct a study on your local stream or river.
One thing to be aware of with CDEC is that the website can get pretty busy and bogged down during popular use times. If there is a heavy storm event and people and agencies are looking for river data and flood conditions, this website might get really slow and pages might not load as quickly, so be patient.
There are of course other stream gage websites and resources available, but the two I mention today, in my opinion, are some of the best and easiest to use. I hope you take the time to learn about these resources, so that when the rains come down next, you can easily locate the stream condition data and the information that is most useful for you, your family, your business, or your travel plans.
To review, below are some handy links to the stream gages most relevant to those living around Clear Lake. I would suggest opening each website in your browser and bookmarking them. I like to view each one at least once a day during the rainy season, but then again, I am a data nerd.
Scotts Creek Gage California Nevada River Forcast Network
https://www.cnrfc.noaa.gov/graphicalRVF.php?id=SKPC1
Middle Creek Gage California Nevada River Forecast Network
https://www.cnrfc.noaa.gov/graphicalRVF.php?id=MUPC1
Kelsey Creek Gage Californioa Nevada River Forecast Network (Kelsey Creek Upstream of Kelseyville)
https://www.cnrfc.noaa.gov/graphicalRVF.php?id=KCVC1
Kelsey Creek gage CDEC (Downstream at Soda Bay Road)
https://cdec.water.ca.gov/jspplot/jspPlotServlet.jsp?sensor_no=20400&end=&geom=small&interval=2&cookies=cdec01
CDEC for Clear Lake and Cache Creek System (aggregate of 9 River and Lake sites)
https://cdec.water.ca.gov/river/cacheStages.html
Sincerely,
Lady of the Lake
Angela De Palma-Dow is a limnologist (limnology = study of fresh inland waters) who lives and works in Lake County. Born in Northern California, she has a Master of Science from Michigan State University. She is a Certified Lake Manager from the North American Lake Management Society, or NALMS, and she is the current president/chair of the California chapter of the Society for Freshwater Science. She can be reached at This email address is being protected from spambots. You need JavaScript enabled to view it..